Smart Gantt + Kanban

Gantt chart software that thinks ahead instead of looking back

Most Gantt tools draw the plan. Gantivity's smart Gantt computes it: AI-generated schedules, dependency and calendar-aware bars, a live critical path, daily progress from the field, and delay prediction — with Kanban alongside for teams who work in flow.

Gantt chart fundamentals: what the bars actually mean

A Gantt chart is a horizontal bar chart of a schedule: each bar is an activity positioned in time, its length is the duration, and the links between bars encode dependency logic — this cannot start until that finishes, these two can overlap by a week. A century after Henry Gantt popularised the format, it remains the standard because it answers the two questions every project lives on: what happens when, and which activities drive the end date.

The second question is the important one, and it's where casual Gantt tools quietly fail. The chain of activities with zero float — the critical path — determines the completion date. Slip anything on it and the project slips with it; slip anything off it and you've only consumed float. A Gantt chart that doesn't compute the critical path from real dependency logic is a timeline drawing, not a schedule. It will happily show you bars that are impossible to achieve.

So the baseline requirements for serious Gantt chart software are: true dependency links (not just visual arrows), working calendars (a five-day site week, a monsoon shutdown), computed critical path, and WBS structure for programmes with thousands of activities. Gantivity has all of these. What makes it different is what it adds on top.

What makes Gantivity's Gantt smart

AI generation: the network builds itself

Describe your scope in plain language and Gantivity Studio drafts the whole network — WBS levels, activities, durations, logic links, calendars — and computes the critical path. You refine it in conversation and baseline when it holds. The slowest part of Gantt scheduling, manual network construction, is gone. Full detail on the AI construction scheduling page.

Live field data: bars that reflect the site, today

Progress on Gantivity's Gantt comes from daily progress reports filed at the work face — notes, percent progress, time, issues. The chart you look at on Tuesday morning reflects Monday's site, not the last monthly update. Execution signals mark each activity as on track, behind, or blocked directly in the view.

Delay prediction: the chart warns you first

Because the Gantt sits on live data, Gantivity can compare actual progress rates against planned ones and flag activities and milestones that are trending late — before the bar formally slips. Ask "what if structure slips a week?" and see the impact on the driving path immediately. That converts the Gantt from a record of intentions into a leading indicator — the heart of modern project controls.
Smart Gantt

A Gantt chart that thinks ahead

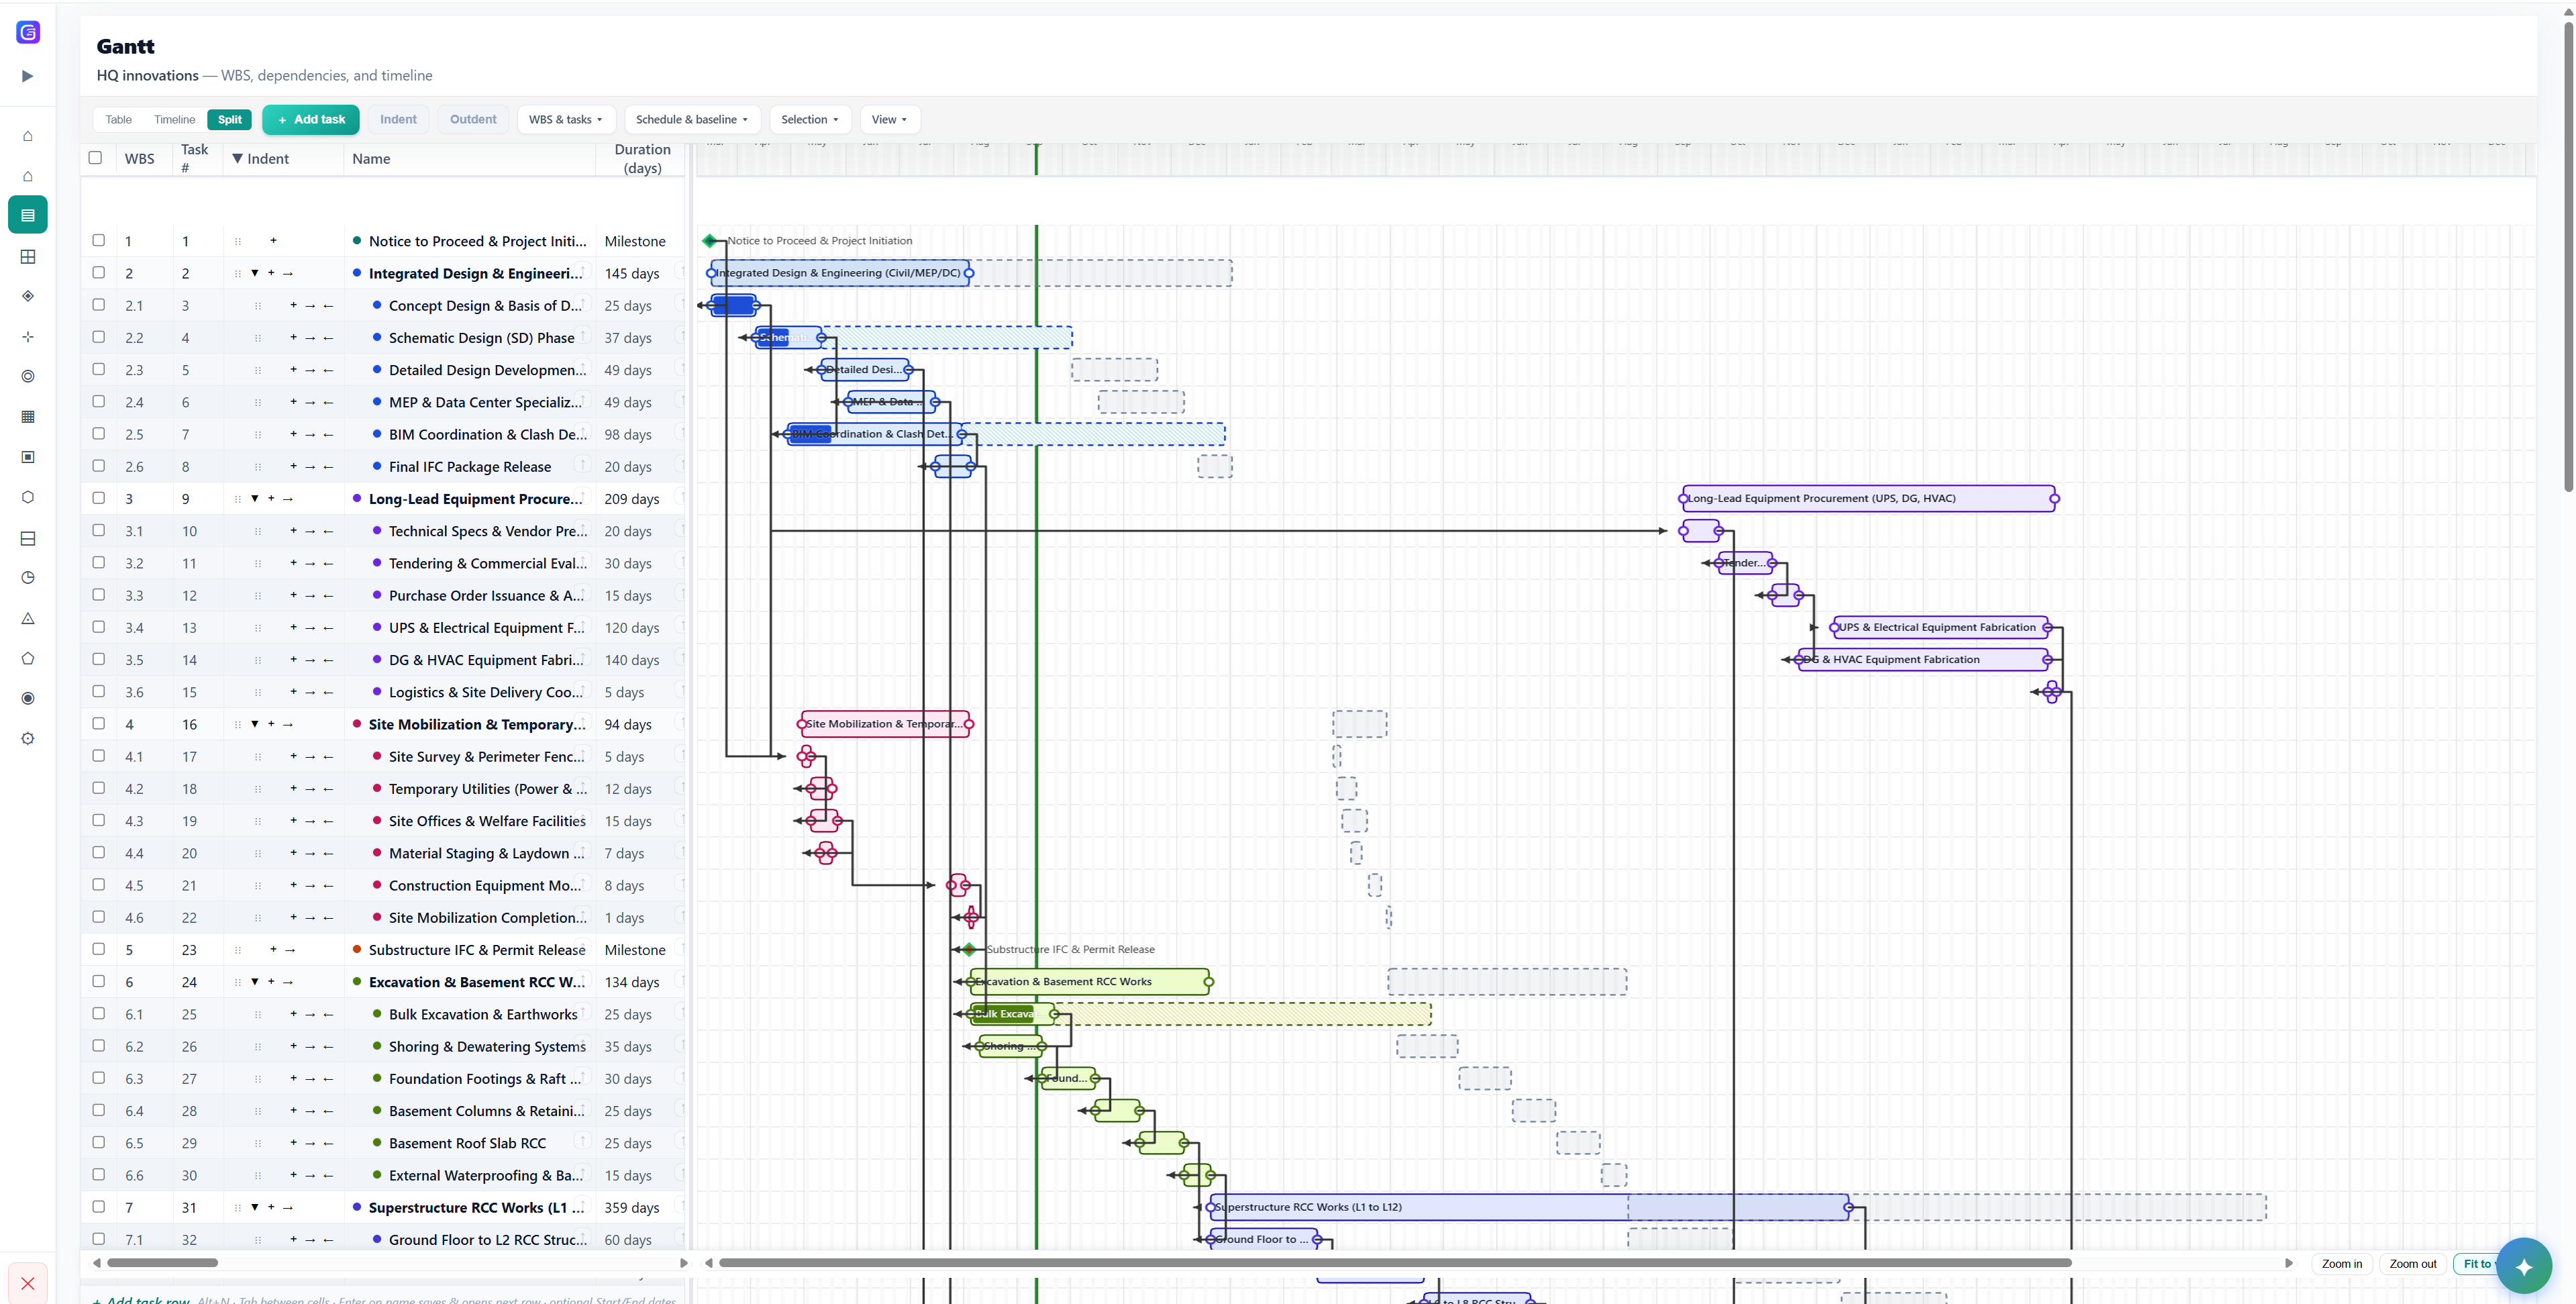
Dependency and calendar-aware bars, live critical path highlighting, and early overrun warnings — for programmes from a single fit-out to multi-year infrastructure.

  • Critical path highlighting and early overrun warnings
  • Scenario planning: instant "what if we slip?" answers
  • Multi-phase programmes with thousands of tasks
See it in the product →
Gantivity smart Gantt chart with dependencies, calendars, and critical path highlighting

What the smart Gantt adds to the classic chart

AI-drafted network

Plain-language scope becomes WBS levels, activities, dependencies, and calendars in Studio — the slowest part of Gantt scheduling, done in minutes.

Bars fed by the site

Daily progress reports from the work face update the chart automatically. Execution signals mark each activity on track, behind, or blocked.

Warnings before the slip

Delay prediction compares actual rates against the plan and flags activities trending late — while the mitigation is still cheap.

Gantt vs Kanban: when to use each

Gantt and Kanban answer different questions, and mature teams usually need both. The Gantt answers "are we on time, and what drives the date?" Kanban answers "what should I pull next, and where is work piling up?"

  • Use the Gantt when work is time-bound and dependency-driven: construction phases, engineering deliverables, procurement with lead times, anything with a contractual completion date. If sequence matters, you need the network.
  • Use Kanban when work is flow-driven and items are broadly interchangeable: snag lists, punch items, small repetitive tasks, support queues. If throughput matters more than sequence, the board beats the bars.

The mistake to avoid is running them as separate tools with separate task lists — that recreates the fragmentation problem inside your own team. In Gantivity, Gantt and Kanban are two views over the same tasks: the planner sequences in the Gantt, a finishing crew pulls from the board, and a card moved on the board updates the same activity the Gantt tracks. One dataset, two working styles.

Choosing Gantt chart software: a short checklist

  • Real scheduling engine — dependencies, calendars, computed critical path. Test it: change one duration and see if downstream dates move correctly.
  • A way to get data in — AI generation from scope, templates, or import. If building the network takes weeks, it won't be rebuilt when the plan changes.
  • A way to keep it current — structured field updates, not a planner re-keying chat messages. This is where most Gantt deployments die.
  • Forward-looking analysis — trend-based delay warnings and scenario answers, not just a baseline comparison after the fact.
  • Shared access — every stakeholder reads the same live chart, instead of interpreting PDF exports of a desktop file.

Traditional desktop tools score well on the first point and poorly on the rest — see our honest comparisons with Microsoft Project and Primavera P6. For the platform around the chart — DPRs, issues, messaging, AI reports — see construction project management software, and current plans on pricing. More scheduling practice on the blog.

Gantt chart software: common questions

What is a Gantt chart?
A Gantt chart is a horizontal bar chart of a project schedule: each bar is an activity positioned in time, with its length showing duration and links between bars showing dependencies. Read together with the critical path, it answers the two questions every project lives on — what happens when, and which activities actually drive the end date.
What makes Gantivity's Gantt chart smart?
Five things: schedules can be generated by AI from plain-language scope; bars respect dependency logic and working calendars rather than being drawn freehand; the critical path is computed and highlighted live; daily progress from the field updates the bars automatically; and delay prediction flags activities trending late before they slip. It is a scheduling engine with a Gantt view, not a drawing of one.
Does Gantivity compute the critical path?
Yes. Gantivity computes a Gantt-backed critical path from the dependency network and calendars, highlights it on the chart, and recomputes it as field data arrives. You can also run scenario questions — what happens if this activity slips a week — and see the impact on the driving path immediately.
Gantt vs Kanban — which should we use?
Use Gantt when work is time-bound and dependency-driven: construction phases, engineering deliverables, anything with a contractual end date. Use Kanban when work is flow-driven: snag lists, small repetitive tasks, support queues. Gantivity provides both views over the same tasks, so planners work in the Gantt while crews who think in queues work in Kanban — without splitting the data.
Can the Gantt handle large construction programmes?
Yes. Gantivity is built for multi-phase programmes with thousands of tasks, WBS levels, and working calendars that reflect site reality such as weather windows and shutdowns. Execution signals and filters keep large charts readable by surfacing what is behind, blocked, or at risk.
Do we need scheduling expertise to use Gantt chart software?
Less than you used to. In Gantivity, the AI drafts the network — activities, dependencies, durations, calendars — from your scope description, and you refine it in conversation. Understanding your delivery strategy is still your job; wiring hundreds of logic links no longer is.

Get a Gantt chart that earns its place on the wall

AI-generated, field-fed, and forward-looking. Early access is open for construction, infrastructure, and enterprise teams.